FCV Finances
David Williams (bio)
Introduction
The Commission had been a very successful organisation for more than six decades. The initial challenges from the 1920’s of rehabilitating severely degraded forests, developing sustainable forest management and providing effective protection of the forests were largely achieved. The Commission met a number of special challenges requiring good planning and organisation, and often having to scale up quickly to undertake new unfamiliar tasks. Some of the special challenges included:
- providing employment for large numbers of unemployed people during difficult economic times
- the devastating 1939 bushfires
- implementing a large scale timber salvage program after 1939
- producing emergency firewood and charcoal, and increasing timber production as part of the World War II effort
- increasing forest production to supply the post-war construction boom
- opening up new forest areas in eastern Victoria for timber supply
- implementing a large scale plantation expansion program to provide for the State’s future timber needs.
At the same time the FCV advanced the many core forest management activities fundamental to a forestry organisation.
It was an organisation of substantial expertise and achievement and demonstrated its ability to adapt, innovate and achieve complex goals. The Commission’s proud record of achievement is described more fully in another report titled ‘A Brief History of the Forests Commission Victoria Challenges and Achievements’. This earlier report describes the Commission’s work whilst this current report focuses on the financial arrangements underpinning the Commission’s work from 1919 – 1983.
The achievements required provision of adequate funding from the government of the day. Making the case and receiving annual funding was a priority, as finances were always a concern for the FCV. A constant over six decades was the Commission’s representations for increased funds as there never seemed to be enough money to carry out its full work programs. Over time funds made available increased reflecting expanding demands of managing Victoria’s forests and the sources of funds became more varied and complex. Revenue was modest in the early years with royalties being less than desired because of the high level of illegal removal of produce and an inadequate licensing system that enabled licensees to remove large quantities of produce far in excess of a fair royalty payment. Revenue grew over time as the quantity of produce removed from the forests increased, more appropriate systems of royalty determination were introduced and other enterprises were initiated and expanded . This brief report outlines the basis and changing nature of the Commission’s financial arrangements.
The initial Forests Department established in 1907 was less successful than desired in large part due to limited finances. This was clearly understood by the Commission from the outset. The Commission’s brief and early challenges were substantial and success was absolutely dependent on adequate funding. Reliability of funding was also important to allow planning and delivery of work programs based on long term goals.
The Commission was established under the Forests Act 1918 which provided the framework for the Commission’s policies covering the following:
- protect and expand the forest estate
- apply sound forest management
- expand softwood plantations
- ensure reliable and increased funding
- undertake research to solve forest management problems and improve practices
- support and assist the development of forest industries
Early work programs were substantial and comprehensive and included fire protection works, cultural treatments to rehabilitate degraded indigenous forests, works to successfully regenerate harvested forests, surveys to establish forest boundaries, assessments to estimate the quantity and quality of timber resources, controlling the removal of forest produce, ensuring proper payment of royalties, establishing softwood plantations and assisting the development of forest industries.
Expenditure and revenue were matters of primary importance from the outset. On the expenditure side, the Commission needed sufficient funds to be able to successfully implement its policies. Regarding revenue, an early priority was to increase royalties and ensure that royalty was paid on all produce removed from the forest. An aim was to increase royalties to a level “that represents a fair return on the true value of the forest products”. This was to be achieved through improved supervision and control of the removal of forest products and increasing royalty collections.
As a government department the Commission was not driven by commercial considerations for the most part and revenue and expenditure were largely unconnected. Revenue went into the Government’s consolidated revenue and the majority of expenditure was provided by funds determined annually by the Government. Ensuring adequate funding to support the extensive works programs on an ongoing basis was a primary challenge for the Commission. Its budget was very much influenced the State’s financial standing and by the Government’s overall priorities with many competing demands for its limited financial resources as well as the merits of the Commission’s requests.
The Commission was initially of the view that the provided funds were insufficient to successfully complete its works programs and accordingly, an early action was to make representations to the Government for increased funds. Amounts provided annually varied and generally increased over time. However, over the more than six decades the total amounts made available were considered inadequate by the Commission and, as a consequence, some activities were less than desired. In particular treatments to rehabilitate degraded indigenous forests and fire protection works in the early decades fell short of desired levels. Overall the funding provided by government enabled the Commission to achieve most of its goals.
The Commission quickly recognised the funding was inadequate and made strong representations for increased funding which were partly successful.
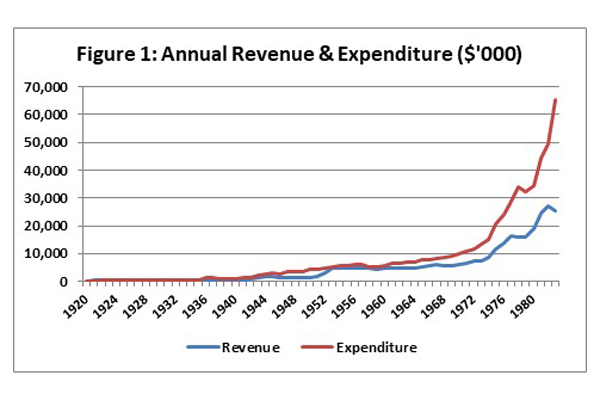
Revenue and expenditure were quite modest in the Commission’s first year of operation. Total revenue of $190,000 1 exceeded expenditure of just $142,000 and royalty represented 64 per cent of total revenue. These early year trends changed substantially over the next six decades as shown in figures 1 and 2. Expenditure increased much faster than revenue and annual revenue was on average just 56 per cent of annual expenditure overall. This reflects that forestry goals included commercial and non-commercial objectives. As well as production and sale of forest produce, an extensive component of work involved non-commercial activities including forest protection, provision of grazing, water conservation and production, forest recreation, and protection and enhancement of aesthetic values and biodiversity.
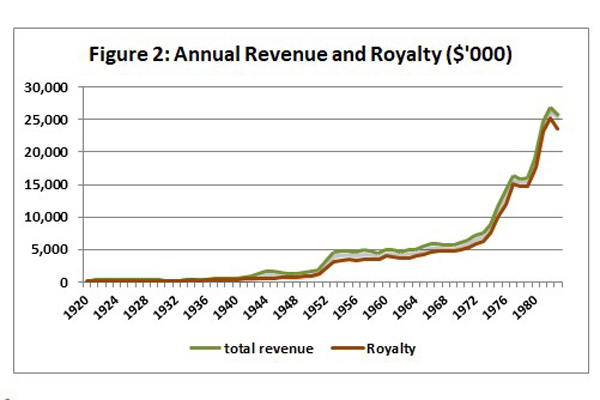
Royalty was the dominant source of revenue averaging 85 per cent of total revenue over the life of the Commission.
Expenditure
The inclusion of the Forestry Fund in the Forest Act 1918 was an improvement on the financial arrangements experienced by the Commission’s predecessor. The Fund provided improved funding reliability but it was inadequate with the result that forest rehabilitation and fire protection works were severely limited in the early years.
Following repeated representations in the initial years, the Government increased overall funding through a large Forestry Loan Fund of £500,000 ($1 million) to be spent over 5 years. Loan Funds would become a normal ongoing part of the Commission’s funding. The other source of funding was Appropriations which was the amount provided annually as determined by Parliament.
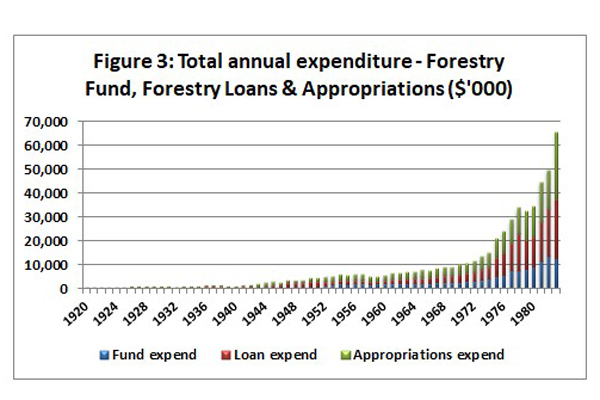
The annual amounts of Forestry Fund, Forestry Loans and Appropriations are shown in Figure 3. Forestry Fund, Forestry Loans and Appropriations annually averaged $2.1 million (25 per cent of total expenditure), $3.3 million (37 per cent) and $3.3 million (38 per cent) respectively.
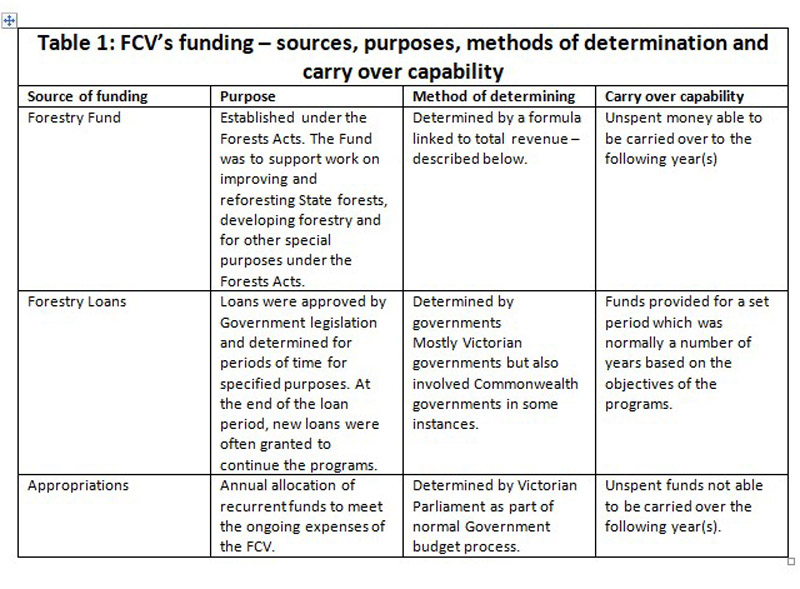
The purposes, methods of determination and carry over capability for each funding source are summarised in Table 1.
Forestry Fund
The Forestry Fund was an important improvement in the Commission’s financial arrangements. It recognised the need for ongoing investment in the State’s forests. It was required to be spent on improving and reforesting State forests, developing forestry and for other special purposes under the Forests Acts. The amount of the Fund was provided on a pre-determined basis linked to revenue. The expenditure was determined by the Governor-in-Council on the Commission’s recommendations which provided direct Commission control over how the money was spent. Ironically the advantage of spending control became a disadvantage by 1982. Increased direct Ministerial control over all government spending was part of the Cain Government’s economic policy when it was elected to office in 1982. Redirecting control over spending from the Commission to the Minister was a contributing factor to the Cain Labor Government’s decision to replace the Commission by integrating it into a new mega-department of Conservation, Forests and Lands in 1983.
The Forestry Fund was established in the Forests Act 1918 and was set at £40,000 ($80,000) plus 50 per cent of gross revenue above £80,000 ($160,000). This provided improved reliability for a significant component of the Commission’s funding.
The importance and effectiveness of the Fund declined over time. In 1932 the base amount of £40,000 used in calculating the annual Fund amount was reduced to £32,000 under the Financial Emergency Act during the Great Depression. The original base was restored in 1940 following Commission representations. By the second half of the 1960’s the Commission raised concerns about declining comparative contribution of the Fund. Royalties were static to declining as timber was increasingly sourced from more distant forests resulting in lower royalty rates. The cost of new fire fighting equipment was increasing as was the cost of labour. Also Treasury had required that amounts from the Forestry Fund be used for general operating expenses which the Commission contended was contrary to the intended purposes of the Fund.
The Parliamentary Public Accounts Committee reviewed the relevance of the Forestry Fund and raised the question of whether it should continue in its report to Parliament in 1968. However it resulted in no change.
The Forestry Fund provided an average of $2.1 million towards expenditure each year although its relative contribution declined over time. The Fund contributed an average of 37 per cent of total expenditure over the first decade from 1902-1929 but declined to just 24 per cent by the Commission’s last decade from 1974-1983.
Forestry Loan Funds
The Commission made strong representations immediately following its establishment about the inadequacy of funding and the urgent need for additional funds to allow the implementation of its substantial works programs. The initial representations were successful with the Government recognising to need for additional funding for specific purposes. This was an historic event at the time in the Government’s commitment to proper management of the State’s forests. It provided a large Forestry Loan Fund of £500,000 ($1 million) to be spent over 5 years. The initial commitment of funds stipulated their use for “systematic development, improvement, conservation and establishment of forests, both of indigenous hardwoods and of the introduced softwood species”. Loan Funds became a normal ongoing part of the Commission’s funding.
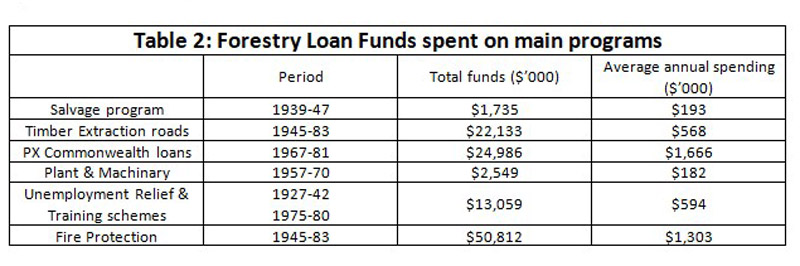
Forestry loans were provided for specific purposes with nominated amounts devoted to particular pursuits. The main purposes in the early decades were native forests, plantations and nurseries. Over time a broader range of activities was provided for under forestry loans, some identified and recommended by the Commission and some from Government initiatives. Some of the main purposes included salvage program following the devastating 1939 fires, contruction of timber extraction roads, plantation expansion program funded by Commonwealth Government loans, purchase of plant and machinary, unemployment relief and training schemes and fire protection. Additional fire protection activities were funded through Appropriations. Forestry loan funds provided an average of $3.2 million per year over the life of the Commission from 1919-1983 with the above programs representing more than 50 per cent of the total loans. The details of the main programs are shown in Table 2.
Appropriations
Appropriations were determined annually as normal part of the Government’s budget process. The amounts made available were influenced by the level of the State’s finances at the time, Government priorities and other competing demands on Government funds as well as the merits of the Commission’s case for funds. Appropriations increased and decreased from year to year and there was sometimes a tendency to use Appropriations to balance the total funds made available to the Commission.
Appropriations covered expenditure items including administration costs, salaries and wages, buildings, fire suppressions costs in part, business enterprises, Victorian School of Forestry and other programs from time to time. Some of the significant programs included production of charcoal and emergency firewood during and immediately following the war years and contributions to the National Sirex Fund.
Appropriations declined for a five year period in the late 1950’s-early 1960’ because of constraints on overall Government spending. Some amounts were diverted from Forestry Fund to cover general operating expenses during this period to the Commission’s disappointment.
Revenue
Annual revenue and royalty are shown in Figure 2. The main components of revenue included royalty and sale of produce produced directly from Commission operations are shown in Table 3.
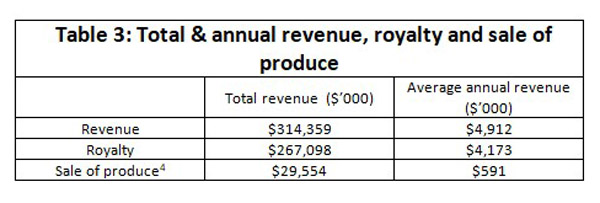
Annual revenue averaged $4.9 million, royalty $4.2 million and sale of produce averaged $0.6 million. Sale of produce commenced in 1934 and continued until 1983 and was a significant activity from 1943. Royalty was the overwhelming component contributing 85 per cent to total revenue with sale of produce contributing nine percent.
Royalty Revenue
Two main changes with method of royalty determination occurred in 1938 and in 1950. The first change was the Commission’s success after prolonged efforts to introduce a system of charging royalty on log volume delivered to sawmills instead of the previous system where royalty was charged on the volume of sawn timber. The earlier system resulted in significant undercharging because it was based on sawn timber volume reported by the sawmiller. It had the disadvantage of delayed and reduced reported volumes in cases where green timber was dried on the sawmill site because royalty was paid when the timber was despatched and there was volume loss during drying. Also the system tied up significant numbers of Commission personnel supervising movement and reporting of sawn timber at the mill. The new system resulted in a significant increase in royalty revenue. For example, the average annual royalty revenue from 1930-39 was $237,000 and this more than doubled to $587,000 in the following decade.
The other major change was the introduction of the Royalty equation System (RES) in 1950. Following the loss of Central Highlands forests in the devastating 1939 fires and the overcutting of forests close to Melbourne, forests in Eastern Victoria were opened up to provide new ongoing timber supply sources. A royalty system was needed to ensure that mills based on more distant forests were not disadvantaged compared with sawmills closer to markets. The RES aimed to ‘equalise’ the cost of sawn timber to key markets to ensure royalties were equitable to sawmillers. The total of the royalty and transport costs of selling base grade sawn timber on defined key markets was to be the same for operations accessing that market. The new RES thereby removed the cost disadvantage of obtaining logs from remote forests which supported the opening up of forests more distant from Melbourne. The RES remained in use for more than 40 years. The immediate impact on total royalty revenue is unclear because of impacts of contrasting influences being reduction in royalty rates for timber sourced from more distant forests.
Sale of Produce
Sale of produce from directly controlled operations 2 commenced as early as 1934 but initially at a very modest level. There were three main phases including:
- Initial modest operations from 1934-1942 over which time sale of produce returned an annual average of just $20,000
- Timber salvage program to recover timber burnt in the 1939 fires from 1943-1947. These operations were predominantly carried out by Commission employees and were instituted to augment licensees’ operations to achieve the ambitious program to recover very large volumes of burnt timber over a limited time period. The average annual sales yielded $611,000.
- Combined timber salvage and regeneration operations from 1953–1983. The Commission successfully carried out trial fellings to develop a regime for natural regeneration for Mixed Stringybark forests and the regimes were adapted for River Red Gum and Mountain forests. This resulted in a large expansion in semi-commercial salvage/regeneration operations which involved removing ill-formed and defective trees and retaining selected seed trees. Utilisable timber was recovered from removed trees and the produce sold to provide revenue to off-set the cost of the silvicultural treatment. The operations were carried out by private contractors and Commission employees. These operations became a main method of forest improvement for three decades. The revenue from selling the produce was significant producing an annual average income of $789,000 which represented more than eight per cent of total revenue over the period.
Other Sources of Revenue
The Commission undertook a number of business enterprises in its earlier years including timber seasoning, two sawmills, a eucalyptus oil distillery, a steel tramway, and a one-off opportunistic export sale of hardwood poles . The primary objectives were specific to each business and the general purpose was to either provide leadership in a new area of forest products to encourage private companies to follow, or supplement overall production because of limited private sector capacity.
The revenue generated by these enterprises was significant for the periods of their operation but the collective contribution to total revenue from 1919-1983 was insignificant being less than two per cent of total revenue.
Inflation Effects
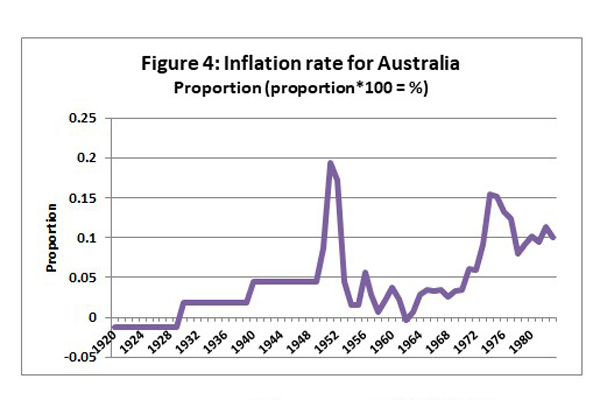
Australia experienced high rates of inflation for the period of the Commission’s operations. The average annual rate of inflation for the period 1920-1983 was 4.4 per cent whereas the average annual inflation rate has been 3.4 per cent for the period since (1983-2021). There were two periods of very high inflation, those being 1940-1953 when average annual inflation was 6.7 per cent and 1971-1983 when the average rate was 10.4 per cent. Australian annual inflation rates are shown in Figure 4.
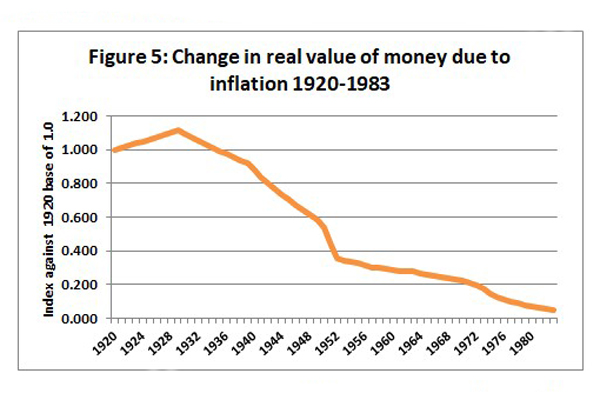
High inflation provides challenges interpreting financial data over a time series. For example, total expenditure in 1920 was just $0.14 million which increased by a factor of 460 times to $65.5 million by 1983. The question then is how much of this was due to real increases and how much was due to inflation? Another way to understand the inflationary impact is to consider that one dollar in 1920 had an equivalent purchasing power of $19 in 1983. The change in the real value of money due to inflation is shown in Figure 5. Figure 5 enables the calculation of equivalent purchasing power (the inflation effect) of $1 in 1920 for any subsequent year. For example, the equivalent purchasing power in 1964 of $1 in 1920 is $3.73 (1/0.268).
It is worthwhile considering the inflationary effects on revenue and expenditure over the Commission’s life to provide a more realistic impact of various initiatives and other factors on expenditure and revenue.
The total expenditure excluding inflation (by applying multipliers in figure 5 above) over the Commission’s life was $108.0 million and average annual expenditure was $1.7 million. Total revenue excluding inflation was $60.8 million and the average annual revenue was $1.0 million. The annual expenditure excluding inflation increased 24 fold from $0.14 million in 1920 to $3.4 million in 1983 and revenue increased seven fold from $0.2 million to $1.3 million in 1983. Total expenditure and revenue excluding inflation is shown in Figure 6.
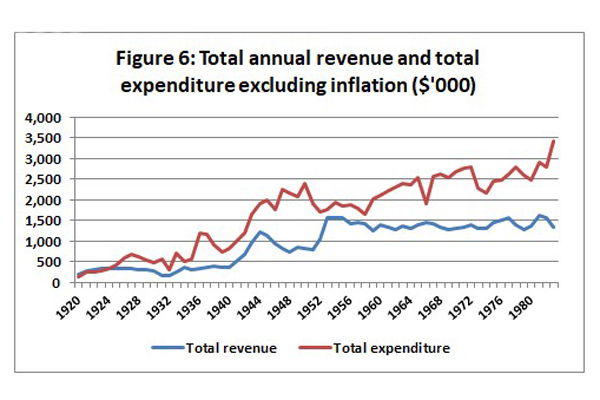
This demonstrates that the overwhelming proportion of the increase in Commission’s expenditure and revenue over the period was due to inflation.
Conclusion
The Commission’s finances were fundamental to its success in managing and protecting the State’s forests. Ensuring adequate funds to implement its work programs was a critical task which the Commission recognised from the outset in the light of its predecessor’s shortcomings resulting from a lack of funds. As a Government department with the charter as the steward of Victoria’s forests, it was not driven by commercial objectives and revenue and expenditure were unconnected.
The Commission was concerned with lack of funding from the time of its establishment. Strong representations to Government for increased funds were a regular activity. The Commission was generally successful is obtaining increased funds over time which enabled it to successfully achieve most of its goals. The major revenue component was royalty and the Commission was able to increase royalty collections through increased log production and significant positive changes to the method of royalty determination.
Australia experienced comparatively high rates of inflation over the six decades of the Commission’s life during which there two periods which extended over 27 years collectively, where inflation was historically very high. One dollar in 1920 had the equivalent purchasing value of $19 by 1983 due to inflation. Hence, the overwhelming driver of the large increase in expenditure and revenue was high rates of inflation.
2 Sale of produce occurred from 1934-1983.